
Editor’s note
- Analysis of gold price trends: Will the year-end rally fail to materialize in 2026?
- Pattern of year-end gold price increases
- Is an early-year rally a less common pattern?
- Was the 2026 all-time high (ATH) already reached in January?
- Patterns to watch
- Don’t rely solely on the 10-year pattern
- What is an ATH?
- Bullish scenario: Gold rises again
- Bearish scenario: Correction continues
- Third scenario: Sideways movement or consolidation
Analysis of gold price trends: Will the year-end rally fail to materialize in 2026?
Long-term gold price movements show an interesting seasonal pattern. Based on observations of gold price data over the past decade, gold has frequently risen during the second half of the year—specifically in August, September, and October.
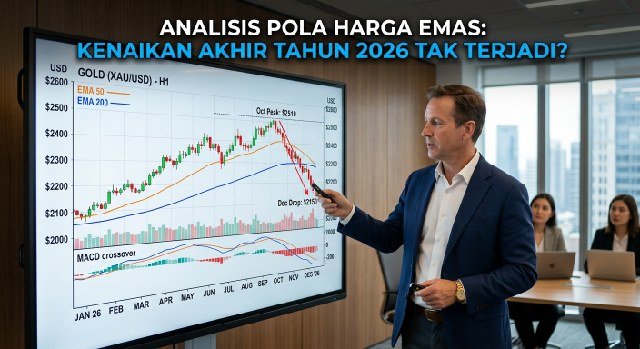
However, 2026 is showing a different pattern. The gold price reached its peak early in the year, in January. This situation raises the question: does gold still have the potential to set a new record by the end of the year, or is it in a correction phase?
Pattern of year-end gold price increases
In recent years, gold prices have tended to rise during the second half of the year. August, September, and October are periods that often draw attention, as the gold price frequently experiences relatively strong gains during these months. This pattern can be described as seasonality—the tendency for price movements to repeat over time based on historical data.
Increases during this period can be driven by various factors, ranging from shifts in interest rate expectations and US dollar fluctuations to investment demand, central bank purchases, geopolitical conditions, and pre-existing demand for gold.
Consequently, investors often use seasonal data as a benchmark to gauge potential market direction. However, seasonality does not guarantee price increases in any given month; fundamental factors and prevailing market conditions in the current year can still override this historical pattern.
Price increases early in the year are less common
Interestingly, there have been several instances over the past decade where the gold price reached its annual peak early in the year.
LATEST NEWS: Bobby Nasution discusses accelerating subsidized housing construction with House of Representatives representatives
This article cites January and March as examples of periods when significant gains occurred. This contrasts with the typical seasonal trend, which more frequently shows price increases during the second half of the year.
This phenomenon demonstrates that gold price patterns do not always align with the calendar. Significant shifts in interest rates, the value of the US dollar, inflation, geopolitics, or demand for safe-haven assets can trigger sharp movements in gold prices, independent of typical seasonal cycles.
Was the 2026 peak already reached in January? The year 2026 is also interesting because the price of gold in rupiah reportedly reached approximately IDR 3.1 million per gram in January, before falling to around IDR 2.5 million per gram in the scenario used in this analysis.
If the January level indeed represents the highest price of 2026 so far, then the movement structure deviates from the usual pattern of a year-end rise.
LATEST NEWS: Telkomsel invites 200 selected IndiHome customers in Medan to a ‘Nobar’ (group viewing) event
The drop from approximately IDR 3.1 million to IDR 2.5 million per gram also indicates that gold has undergone a significant correction from its peak.
However, it is important to remember that reaching an all-time high (ATH) in January does not automatically mean the gold price cannot reach that level again or even surpass it.
Financial markets do not move solely based on seasonal patterns. If major changes occur regarding global interest rates, the US dollar, inflation, geopolitics, central bank purchases, or investor demand, gold prices could still rise and set new records.
Therefore, the conclusion that the likelihood of gold returning to IDR 3 million per gram is “very small” should be viewed as a scenario, not a certainty.
LATEST NEWS: Understanding the causes of growth disorders: Merck introduces takartinggi.com
Examples of patterns to watch
An example often used to observe seasonal patterns is the movement of gold in 2025, when gold prices rose in September and October.
Meanwhile, the early part of the year—such as January and March—can serve as an example of a period when gold may exhibit significant price increases, even outside the usual seasonal window.
If the peak price in 2026 does indeed hover around 3.1 million Indonesian rupiah per gram in January, investors should monitor whether the market can recover to that level by the end of the year.
Do not rely solely on patterns from the past 10 years
Historical data is useful for identifying patterns, but it is not sufficient to definitively determine the direction of the gold price.
Investors should pay attention to various other indicators, such as:
– interest rate policies of central banks, particularly the Federal Reserve;
– price movements of the US dollar;
– yields on US government bonds;
– inflation;
– geopolitical conditions;
– gold purchases by central banks;
– demand for and investment in physical gold;
– global economic conditions; and
– the technical position of the gold price, including support and resistance levels.
Combining these factors results in a more comprehensive analysis than relying exclusively on seasonal patterns.
LATEST NEWS: Indonesia’s young generation must adapt to the changing labor market
What is an ATH?
An ATH, or All-Time High, is the highest price an asset has ever reached during the observed trading period.
In the context of an annual analysis, the term ATH is also often used more specifically to refer to the highest price an asset reached during a particular year. It is therefore important to distinguish between a historical ATH and an annual peak.
Bullish scenario: Gold strengthens again
In a bullish scenario, the correction that occurred after January would essentially be a consolidation phase before the price strengthens again. Several factors that could support this scenario include:
1. Lower interest rates. If major central banks, particularly the Federal Reserve, adopt a looser monetary policy, the appeal of non-yielding assets like gold could increase.
2. A weakening US dollar. Global gold prices generally have an inverse relationship with the US dollar. A weaker dollar could make gold more attractive to holders of other currencies.
3. Rising geopolitical uncertainty. Escalating geopolitical tensions can boost demand for assets considered safe havens, including gold.
LATEST NEWS: Drop in gold price: opportunity or threat for investors?
4. Continued gold buying by central banks. Central bank demand is a key structural factor in the gold market. If demand remains strong, it could support prices.
5. Investor return following a correction. A significant price drop could prompt some investors to view gold as an attractive investment again, especially if the fundamental outlook remains positive.
If these factors coincide, gold could retest the level of 3 million to 3.1 million Indonesian rupiah per gram. If buying pressure is strong enough, the possibility of reaching a new high remains.
In other words, the all-time high seen in January might not be the final peak of 2026.
Bearish scenario: Correction continues
Conversely, in a bearish scenario, the decline from the January level continues as macroeconomic factors prove unfavorable for gold.
Some factors that could exert pressure include:
1. Interest rates remaining high. If central banks keep interest rates high for longer than expected, interest-bearing assets such as bonds could become more attractive than gold.
LATEST NEWS: Siak Public Prosecutor’s Office Oversees Village Development
2. The US dollar strengthens. A stronger US dollar can put pressure on the price of gold, which is denominated in dollars.
3. Bond yields rise. A rise in real yields on US bonds can reduce the appeal of gold, which pays neither interest nor dividends.
4. Geopolitical tensions ease. If geopolitical risks subside significantly, demand for gold as a safe-haven asset may also decline.
5. Investors take profits. Following the earlier significant rise, investors who have made gains may choose to take profits. This selling pressure could prolong the correction phase.
In a bearish scenario, gold prices could remain below the January peak and enter a prolonged correction or consolidation phase.
However, the extent of the correction still depends on fundamental and technical market conditions.
Third scenario: sideways movement or consolidation
In addition to bullish and bearish trends, there is a third possibility: sideways movement. In this scenario, the gold price does not immediately return to its all-time high, nor does it drop sharply. The price moves within a specific range while awaiting a new catalyst.
LATEST NEWS: Implementing occupational hygiene is crucial for preventing workplace accidents
This scenario can occur when bullish and bearish factors balance each other out. For instance, central banks continue to support gold through purchases, while the US dollar and bond yields remain strong.
Under such conditions, it may take some time for the gold price to determine its next direction.
Conclusion
Data from the past decade shows that gold tends to rise seasonally during the second half of the year, particularly between August and October. However, there are also periods when the gold price reaches its peak early in the year.
If the peak price for 2026 to date was reached in January—at approximately 3.1 million Indonesian rupiah per gram—then this year’s pattern deviates from that seasonal trend.
However, the fact that the peak occurred in January does not necessarily mean the gold price will continue to fall or that no new records will be set. Future price movements will still be determined by a combination of fundamental, macroeconomic, geopolitical, market sentiment, and technical factors.
LATEST NEWS: With a large 6,000 mAh battery, the Samsung Galaxy A08 is the perfect phone for long-term daily use
For investors, seasonality should serve as just one element of analysis, not as the sole basis for investment decisions.
Disclaimer: This article is intended solely for educational and informational purposes and does not constitute a recommendation to buy or sell gold. Historical data and seasonal patterns do not guarantee future performance or prices. Any investment decision should be aligned with your objectives, risk profile, and financial situation, and should be evaluated against the most recent price data. ***tok
- Analisis Pola Harga Emas: Kenaikan Akhir Tahun 2026 Tak Terjadi?
- Pola Kenaikan Harga Emas pada Akhir Tahun
- Kenaikan di Awal Tahun Merupakan Pola yang Lebih Jarang
- ATH 2026 Sudah Terjadi pada Januari?
- Contoh Pola yang Perlu Diperhatikan
- Jangan Hanya Mengandalkan Pola 10 Tahun
- Apa Itu ATH?
- Skenario Bullish: Emas Kembali Menguat
- Skenario Bearish: Koreksi Berlanjut
- Skenario Ketiga: Sideways atau Konsolidasi
Analisis Pola Harga Emas: Kenaikan Akhir Tahun 2026 Tak Terjadi?
Pergerakan harga emas dalam jangka panjang menunjukkan adanya pola musiman yang menarik. Berdasarkan pengamatan terhadap data harga emas selama sekitar 10 tahun terakhir, emas relatif sering mencatat penguatan pada paruh kedua tahun, terutama memasuki Agustus, September, hingga Oktober.
Namun, tahun 2026 menghadirkan pola yang berbeda. Harga emas justru telah mencatat level tertingginya pada awal tahun, tepatnya pada Januari. Kondisi tersebut menimbulkan pertanyaan: apakah harga emas masih memiliki peluang untuk kembali mencetak rekor baru menjelang akhir tahun, atau justru memasuki fase koreksi?
Pola Kenaikan Harga Emas pada Akhir Tahun
Dalam beberapa tahun terakhir, pergerakan harga emas menunjukkan kecenderungan penguatan pada paruh kedua tahun. Agustus, September, dan Oktober menjadi periode yang sering mendapat perhatian karena harga emas relatif kerap mengalami kenaikan.
Pola tersebut dapat disebut sebagai seasonality, yaitu kecenderungan pergerakan harga yang berulang pada periode tertentu berdasarkan data historis.
Kenaikan pada periode tersebut dapat dipengaruhi berbagai faktor, mulai dari perubahan ekspektasi suku bunga, pergerakan dolar AS, permintaan investasi, pembelian bank sentral, kondisi geopolitik, hingga kebutuhan emas menjelang periode tertentu.
Karena itu, data musiman sering digunakan investor sebagai salah satu referensi untuk membaca kemungkinan arah pasar. Namun, seasonality bukan berarti harga pasti naik pada bulan tertentu. Faktor fundamental dan kondisi pasar pada tahun berjalan tetap dapat membuat pola historis tersebut tidak berlaku.
Kenaikan di Awal Tahun Merupakan Pola yang Lebih Jarang
Menariknya, dalam rentang data sekitar satu dekade, terdapat beberapa periode ketika harga emas justru mencapai level tertinggi tahunannya pada awal tahun.
Dalam materi ini, Januari dan Maret disebut sebagai contoh periode ketika kenaikan signifikan terjadi lebih awal. Kondisi seperti ini berbeda dengan kecenderungan musiman yang lebih sering menunjukkan penguatan pada paruh kedua tahun.
Fenomena tersebut menunjukkan bahwa pola harga emas tidak selalu berjalan sesuai kalender. Ketika terdapat perubahan besar dalam suku bunga, nilai dolar AS, inflasi, geopolitik, atau permintaan safe haven, harga emas dapat bergerak kuat tanpa menunggu periode musiman yang biasanya menjadi perhatian.
ATH 2026 Sudah Terjadi pada Januari?
Tahun 2026 juga menarik karena harga emas dalam rupiah disebut telah mencapai sekitar Rp3,1 juta per gram pada Januari, sebelum kemudian bergerak turun ke kisaran Rp2,5 juta per gram dalam skenario yang digunakan pada analisis ini.
Jika level Januari tersebut memang merupakan harga tertinggi sepanjang 2026 hingga saat ini, maka struktur pergerakannya berbeda dari pola yang biasanya menguat pada akhir tahun.
Penurunan dari sekitar Rp3,1 juta menuju Rp2,5 juta per gram juga menunjukkan bahwa emas telah mengalami koreksi yang cukup besar dari level tertingginya.
Namun, satu hal penting perlu diperhatikan: tercapainya ATH pada Januari tidak otomatis berarti harga emas tidak dapat kembali mencapai atau bahkan melampaui level tersebut.
Pasar keuangan tidak bergerak berdasarkan pola musiman saja. Jika terjadi perubahan besar pada suku bunga global, dolar AS, inflasi, geopolitik, pembelian bank sentral, atau permintaan investor, harga emas tetap dapat kembali menguat dan mencetak rekor baru.
Dengan demikian, kesimpulan bahwa peluang emas kembali ke Rp3 juta per gram “sangat kecil” sebaiknya dipandang sebagai sebuah skenario, bukan kepastian.
Contoh Pola yang Perlu Diperhatikan
Salah satu contoh yang sering digunakan untuk melihat seasonality adalah pergerakan emas pada 2025, ketika harga emas mengalami penguatan pada periode September dan Oktober.
Sementara itu, periode awal tahun seperti Januari dan Maret dapat menjadi contoh bahwa emas juga mampu mencatat kenaikan besar di luar periode musiman yang umum diamati.
Pada 2026, jika harga tertinggi memang telah tercapai pada Januari di sekitar Rp3,1 juta per gram, maka investor perlu mengamati apakah pasar mampu kembali mendekati level tersebut menjelang akhir tahun.
Jangan Hanya Mengandalkan Pola 10 Tahun
Data historis memang berguna untuk menemukan pola, tetapi tidak cukup untuk menentukan arah harga emas secara pasti.
Investor sebaiknya memperhatikan beberapa indikator lain, seperti:
– kebijakan suku bunga bank sentral, terutama Federal Reserve;
– pergerakan dolar AS;
– imbal hasil obligasi pemerintah AS;
– inflasi;
– kondisi geopolitik;
– pembelian emas oleh bank sentral;
– permintaan emas fisik dan investasi;
– kondisi ekonomi global; serta
– posisi teknikal harga emas, termasuk area support dan resistance.
Dengan menggabungkan faktor-faktor tersebut, analisis menjadi lebih komprehensif dibandingkan hanya mengandalkan pola musiman.
Apa Itu ATH?
ATH atau All-Time High adalah harga tertinggi yang pernah dicapai oleh suatu aset dalam periode perdagangan yang diamati.
Dalam konteks analisis tahunan, istilah ATH juga sering digunakan secara lebih spesifik untuk menyebut harga tertinggi yang dicapai suatu aset dalam satu tahun berjalan. Karena itu, penting membedakan antara ATH sepanjang sejarah dan harga tertinggi dalam satu tahun.
Skenario Bullish: Emas Kembali Menguat
Dalam skenario bullish, koreksi yang terjadi setelah Januari justru menjadi fase konsolidasi sebelum harga kembali mengalami penguatan.
Beberapa faktor yang dapat mendukung skenario ini antara lain:
1. Suku bunga menjadi lebih rendah. Jika bank sentral utama, terutama Federal Reserve, menerapkan kebijakan moneter yang lebih longgar, daya tarik aset tanpa imbal hasil seperti emas dapat meningkat.
2. Dolar AS melemah. Harga emas global umumnya memiliki hubungan berlawanan dengan dolar AS. Pelemahan dolar dapat membuat emas lebih menarik bagi pemegang mata uang lainnya.
3. Ketidakpastian geopolitik meningkat. Meningkatnya ketegangan geopolitik dapat meningkatkan permintaan terhadap aset yang dipandang sebagai safe haven, termasuk emas.
4. Bank sentral terus membeli emas. Permintaan dari bank sentral menjadi salah satu faktor struktural penting dalam pasar emas. Jika pembelian tetap kuat, hal tersebut dapat memberikan dukungan terhadap harga.
5. Investor kembali masuk setelah koreksi. Penurunan harga yang cukup dalam dapat membuat sebagian investor melihat emas sebagai aset yang kembali menarik, terutama apabila prospek fundamentalnya tetap positif.
Jika beberapa faktor tersebut muncul secara bersamaan, emas berpotensi kembali menguji level Rp3 juta hingga Rp3,1 juta per gram. Apabila tekanan beli cukup kuat, kemungkinan mencetak harga tertinggi baru juga tetap terbuka.
Dengan kata lain, ATH Januari tidak harus menjadi puncak terakhir pada 2026.
Skenario Bearish: Koreksi Berlanjut
Sebaliknya, dalam skenario bearish, penurunan dari level Januari berlanjut karena faktor makroekonomi tidak mendukung emas.
Beberapa faktor yang dapat menjadi tekanan antara lain:
1. Suku bunga tetap tinggi. Jika bank sentral mempertahankan suku bunga tinggi lebih lama dari ekspektasi pasar, aset berbunga seperti obligasi dapat menjadi lebih menarik dibandingkan emas.
2. Dolar AS menguat. Penguatan dolar AS dapat memberikan tekanan terhadap harga emas dalam denominasi dolar.
3. Imbal hasil obligasi meningkat. Kenaikan real yield atau imbal hasil riil obligasi AS dapat mengurangi daya tarik emas yang tidak memberikan bunga atau dividen.
4. Ketegangan geopolitik mereda. Jika risiko geopolitik berkurang secara signifikan, sebagian permintaan safe haven terhadap emas dapat ikut menurun.
5. Investor melakukan profit taking. Setelah kenaikan besar sebelumnya, investor yang telah memperoleh keuntungan dapat melakukan aksi ambil untung. Tekanan jual tersebut dapat memperpanjang fase koreksi.
Dalam skenario bearish, harga emas dapat tetap berada di bawah level tertinggi Januari dan bergerak dalam fase koreksi atau konsolidasi yang lebih panjang.
Namun, besar kecilnya koreksi tetap bergantung pada kondisi fundamental dan teknikal pasar.
Skenario Ketiga: Sideways atau Konsolidasi
Selain bullish dan bearish, terdapat kemungkinan ketiga, yaitu sideways. Dalam kondisi ini, harga emas tidak langsung kembali ke ATH, tetapi juga tidak mengalami penurunan tajam. Harga bergerak dalam rentang tertentu sambil menunggu katalis baru.
Skenario ini dapat terjadi apabila faktor bullish dan bearish saling mengimbangi. Misalnya, bank sentral masih memberikan dukungan terhadap emas melalui pembelian, tetapi pada saat yang sama dolar AS dan imbal hasil obligasi tetap kuat.
Dalam kondisi seperti ini, harga emas dapat membutuhkan waktu sebelum menentukan arah berikutnya.
Kesimpulan
Data 10 tahun terakhir menunjukkan bahwa emas memang memiliki kecenderungan musiman untuk mengalami penguatan pada paruh kedua tahun, khususnya sekitar Agustus hingga Oktober. Namun, terdapat pula periode ketika harga emas justru mencapai level tertingginya pada awal tahun.
Jika pada 2026 harga tertinggi sejauh ini memang terjadi pada Januari di sekitar Rp3,1 juta per gram, maka tahun ini memiliki pola yang berbeda dibandingkan kecenderungan musiman tersebut.
Meski demikian, harga tertinggi yang sudah tercapai pada Januari bukan bukti bahwa harga emas pasti terus turun atau tidak mampu mencetak rekor baru. Pergerakan berikutnya tetap akan ditentukan oleh kombinasi faktor fundamental, makroekonomi, geopolitik, sentimen pasar, dan kondisi teknikal.
Bagi investor, seasonality sebaiknya digunakan sebagai salah satu bahan analisis, bukan sebagai satu-satunya dasar untuk mengambil keputusan investasi.
Disclaimer: Tulisan ini bersifat edukasi dan informasi, bukan rekomendasi untuk membeli atau menjual emas. Data historis dan pola musiman tidak menjamin kinerja atau harga di masa depan. Setiap keputusan investasi perlu mempertimbangkan tujuan, risiko, kondisi keuangan, serta melakukan verifikasi terhadap data harga terbaru. ***tok
READ MORE:
- Could the gold price reach IDR 6 million per gram by 2031?
- Gold at a crossroads: three dates that could determine gold’s direction this week
- Gold prices under pressure, but support at $4,300 remains crucial
- Rudi ‘Golden Boy’ Visits Medan: Igniting the Local Combat Sports Spirit on the Road to the Baku Hantam Championship
- The Rupiah is weakening: should you choose the dollar or gold?